Summary of Weekly Petroleum Data for the Week Ending May 4, 2018

Crude Inventory Data Shows Surprise 2.2M Barrel Draw

Summary of Weekly Petroleum Data for the Week Ending May 4, 2018


U.S. crude oil refinery inputs averaged about 16.5 million barrels per day during the week ending May 4, 2018, 75,000 barrels per day less than the previous week’s average.


Refineries operated at 90.4% of their operable capacity last week. Gasoline production decreased last week, averaging over 9.9 million barrels per day. Distillate fuel production remained virtually unchanged last week, averaging 5.0 million barrels per day.


U.S. crude oil imports averaged over 7.3 million barrels per day last week, down by 1,226 thousand barrels per day from the previous week. Over the last four weeks, crude oil imports averaged about 8.1 million barrels per day, 1.0% less than the same four-week period last year. Total motor gasoline imports (including both finished gasoline and gasoline blending components) last week averaged 803,000 barrels per day. Distillate fuel imports averaged 128,000 barrels per day last week.


U.S. commercial crude oil inventories (excluding those in the Strategic Petroleum Reserve) decreased by 2.2 million barrels from the previous week. At 433.8 million barrels, U.S. crude oil inventories are in the lower half of the average range for this time of year. Total motor gasoline inventories decreased by 2.2 million barrels last week, and are in the upper half of the average range. Both finished gasoline inventories and blending components inventories decreased last week. Distillate fuel inventories decreased by 3.8 million barrels last week and are in the lower half of the average range for this time of year.


Propane/propylene inventories increased by 2.3 million barrels last week, and are in the lower half of the average range. Total commercial petroleum inventories decreased by 1.5 million barrels last week.


Total products supplied over the last four-week period averaged about 20.3 million barrels per day, up by 2.7% from the same period last year. Over the last four weeks, motor gasoline product supplied averaged about 9.5 million barrels per day, up by 2.2% from the same period last year.


Distillate fuel product supplied averaged over 4.2 million barrels per day over the last four weeks, up by 4.1% from the same period last year. Jet fuel product supplied is down 1.5% compared to the same four-week period last year.


Information Source: U.S. Energy Information Administration

Crude Oil Market In 2017

USA has steadily increased its crude oil production over the past decade, and in 2015, the country produced 88 percent more crude oil than it did in 2008. Government researchers also estimate that the United States was the world’s largest petroleum and natural gas hydrocarbon producer in 2015. This is truly a new era for American energy.

The United States is once again an exporter of crude oil, with a January 2016 shipment marking the first freely traded U.S. crude in about four decades. Forecasting the oil prices for the next month or next year, that has always been a game of hit and miss. 

All the more so in the past two years since the oil price crash began. Oil prices rose up in anticipation of tighter crude supply going into 2017 comparatively to 2016.

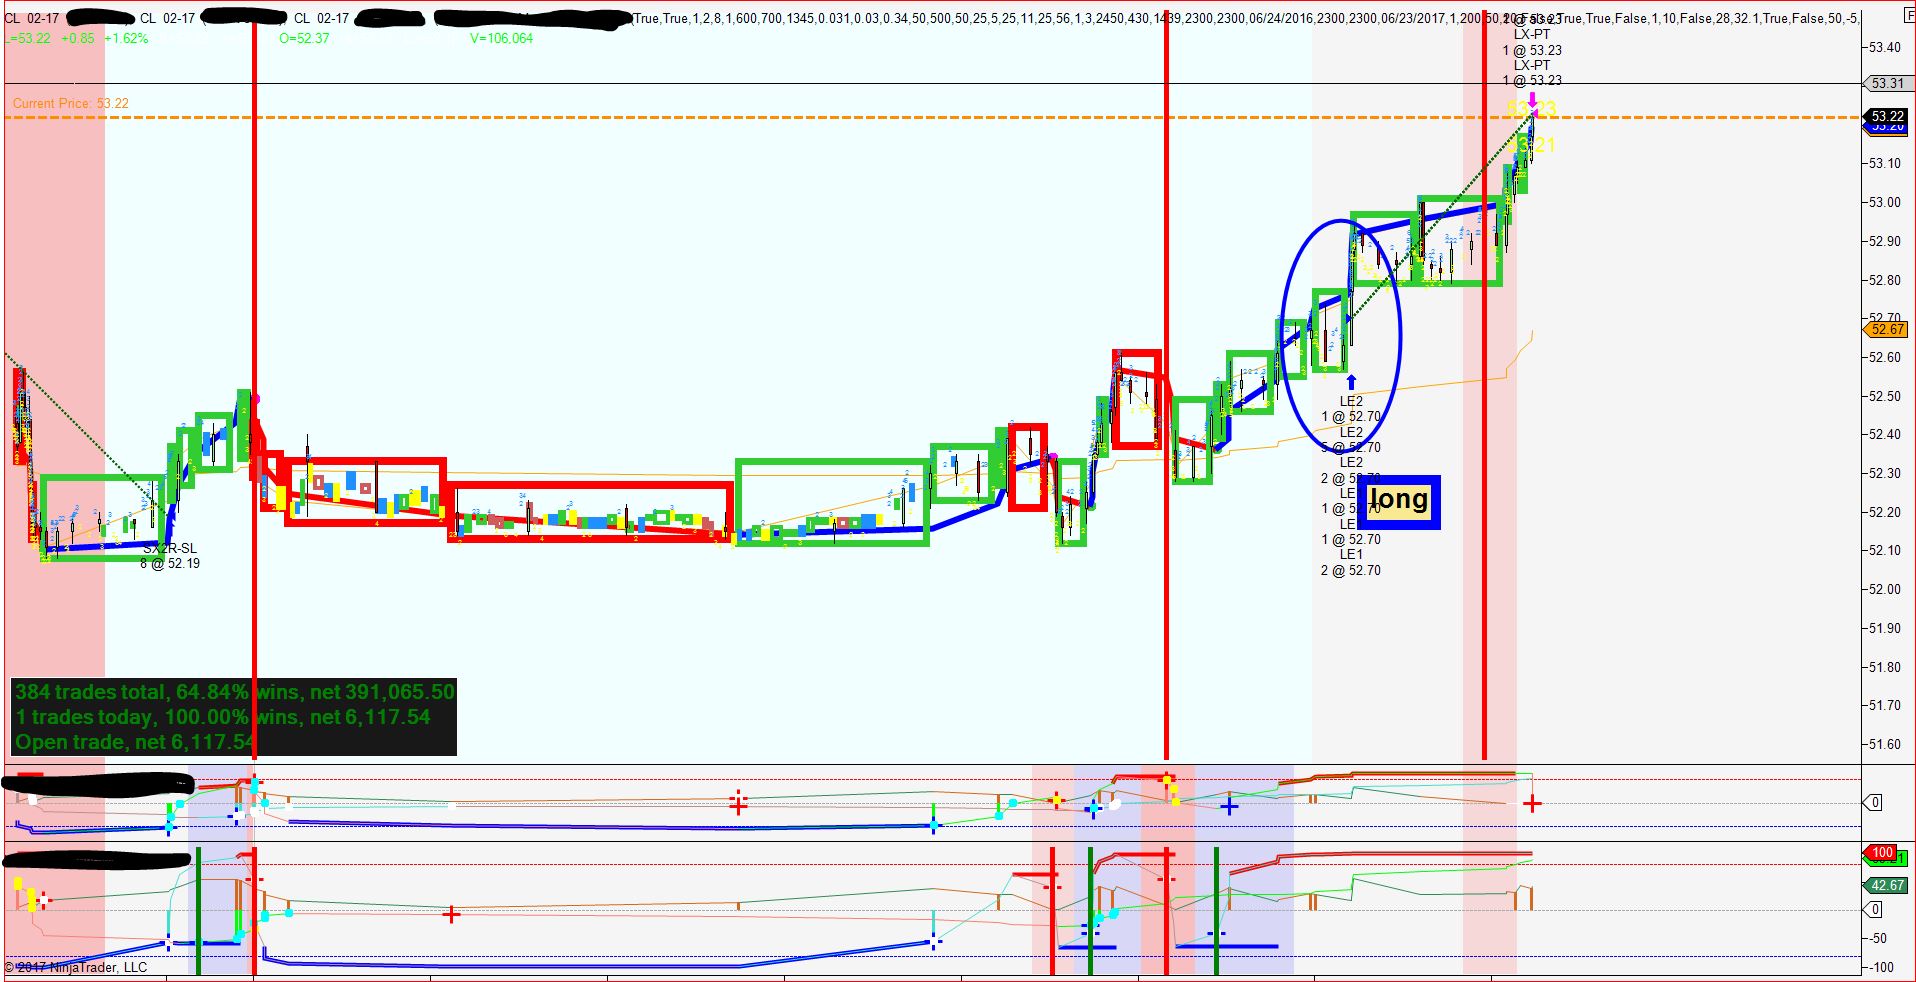
Traders said the higher prices in front-month crude futures were due to expectations of a tighter market. US West Texas Intermediate (WTI) crude oil futures were up 31 cents at $52.21 a barrel.

Here we covers major issues affecting the world oil market and provides an outlook for crude oil market developments for the coming year.


Crude Oil Market Opportunities in 2017

Heading into 2017, the oil price predictions by major organizations and investment banks are generally not widely diverging and hovering in the US$50-$60 range, but there have been some wilder viewpoints that are phenomenally bullish or direly bearish.

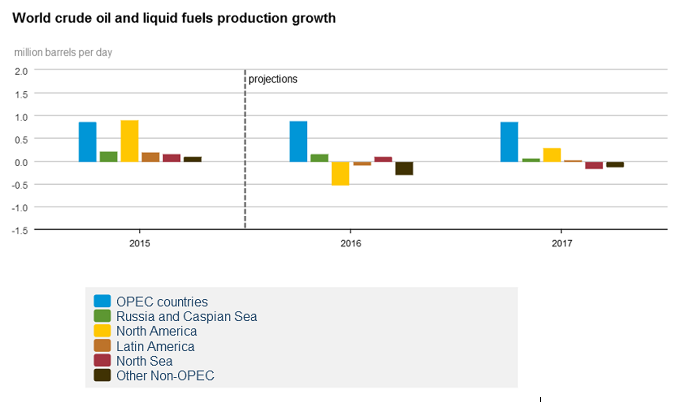
The US Energy Information Administration forecasts US crude oil production to average 8.7 million b/d in 2016 and 8.6 million b/d in 2017. Forecast production in 2017 is almost 100,000 b/d higher than in the previous forecast.

In Russia, recent oil production has been higher than previously forecast, with production exceeding previous records in recent months. In addition, the start-up of fields has resulted in a higher-than-expected outlook for Russian production. Russia’s oil production may increase 190,000 b/d in 2016 and 20,000 b/d in 2017.

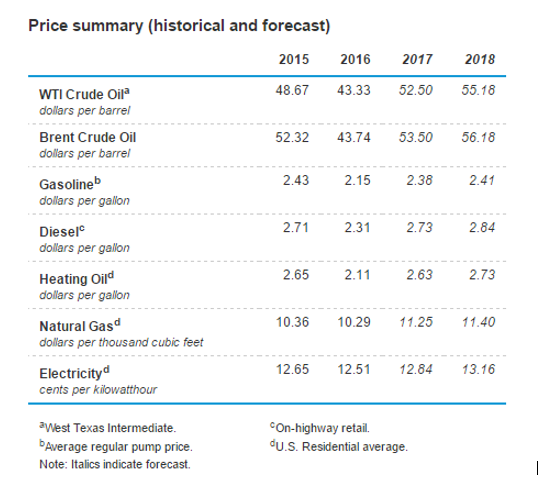
Brent crude oil prices are forecast to average $43/bbl in 2016 and $51/bbl in 2017, $1/bbl higher and $1/bbl lower, respectively. West Texas Intermediate crude prices are forecast to average about $1/bbl less than Brent in 2016 and in 2017.

“Pricing forecasts embed a sequential 500,000 barrel-per-day increase in U.S. crude production, raising domestic output to 9.2 million barrels a day by the end of 2017,” the bank said.


Open