Weekly Crude Oil Storage as of November 1, 2019

U.S. Crude Oil Inventories Increase by 7.9 Million Barrels

Weekly Crude Oil Storage as of November 1, 2019

U.S. commercial crude oil inventories (excluding those in the Strategic Petroleum Reserve) increased by 7.9 million barrels from the previous week. At 446.8 million barrels, U.S. crude oil inventories are about 3% above the five year average for this time of year, according to the EIA crude oil and petroleum weekly storage data, reporting inventories as of November 1, 2019.


Summary of weekly petroleum data for the week ending November 1, 2019

U.S. crude oil refinery inputs averaged 15.8 million barrels per day during the week ending November 1, 2019, which was 237,000 barrels per day less than the previous week’s average. Refineries operated at 86.0% of their operable capacity last week.

  • Gasoline production decreased last week, averaging 10.0 million barrels per day.
  • Distillate fuel production decreased last week, averaging 4.9 million barrels per day.

Imports

U.S. crude oil imports averaged 6.1 million barrels per day last week, down by 620,000 barrels per day from the previous week. Over the past four weeks, crude oil imports averaged about 6.2 million barrels per day, 17.4% less than the same four-week period last year.


Total motor gasoline imports (including both finished gasoline and gasoline blending components) last week averaged 493,000 barrels per day, and distillate fuel imports averaged 306,000 barrels per day.


Products inventories

  • Total motor gasoline inventories decreased by 2.8 million barrels last week and are about 1% below the five year average for this time of year.
  • Finished gasoline inventories increased while blending components inventories decreased last week.
  • Distillate fuel inventories decreased by 0.6 million barrels last week and are about 9% below the five year average for this time of year.
  • Propane/propylene inventories increased by 0.3 million barrels last week and are about 13% above the five year average for this time of year.
  • Total commercial petroleum inventories increased last week by 3.9 million barrels last week.

Products supplied

Total products supplied over the last four-week period averaged 21.2 million barrels per day, up by 2.4% from the same period last year. Over the past four weeks:

  • Motor gasoline product supplied averaged 9.5 million barrels per day, up by 2.7% from the same period last year.
  • Distillate fuel product supplied averaged 4.3 million barrels per day over the past four weeks, up by 2.8% from the same period last year.
  • Jet fuel product supplied was up 7.5% compared with the same four-week period last year.
U.S. oil futures climb as EIA reports a nearly 11 million-barrel fall in weekly U.S. crude supplies- 24 July 2019

U.S. Oil Futures Climb as EIA Reports a Nearly 11 Million-barrel Fall in U.S. Crude Supplies

The Energy Information Administration on Wednesday reported that U.S. crude supplies fell by 10.8 million barrels for the week ended July 19. That was more than double the 4.4 million-barrel decline expected by analysts polled by S&P Global Platts.


The American Petroleum Institute on Tuesday reported an 11 million-barrel drop, according to sources. The EIA data also showed that gasoline inventories were down by 200,000 barrels, while distillate stockpiles rose by 600,000 barrels last week.


The S&P Global Platts survey had shown expectations for a supply decrease of 1.1 million barrels for gasoline, while distillates were forecast to rise by 1.7 million barrels.


September West Texas Intermediate crude was up 64 cents, or 1.1%, to $57.41 a barrel on the New York Mercantile Exchange. Prices were trading at $57.20 before the supply data (link).

British pound hits new two-year low as Brexit pressure continues

The British pound on Wednesday traded at its lowest level in more than two years, as concerns about the prospect of a hasty exit from the European Union continued to pressure the U.K. currency.


The pound GBPUSD, +0.1854% fell as low as $1.2382 vs. the U.S. dollar, down from $1.2407, marking the lowest level since April 2017.


Against the euro, the pound GBPEUR, +0.0632% fell as low as €1.1048, down from €1.1068.


Boris Johnson, the front runner to become the leader of the Conservative Party and therefore prime minister, was reported by Sky News to be considering suspending parliament for two weeks to prevent it from blocking a Brexit. His campaign said that it’s an option but that nothing has been decided.


Another issue is that both Johnson and his Conservative Party rival, Jeremy Hunt, have said they will not accept the so-called Irish backstop deal agreed by the current prime minister, Theresa May, with the European Union. The winner of the Tory party’s vote is expected to be announced on July 23.


“The rising perceived probability of a disorderly Brexit after the Oct. 31 deadline is reflected in the options market, with the sterling implied volatility curve heavily kinked around the deadline date (that is 3-4 month tenors) vs the close-to-normally upward sloping shape of the curve two to three months ago,” said strategists at ING in a note to clients.


The data released Wednesday met economist expectations. Consumer prices in the 12 months ending June stayed at 2%, right at the Bank of England’s target.


Summary of weekly petroleum data for the week ending June 28, 2019

Crude Oil Inventories Down 1.1 Million Barrels

Summary of weekly petroleum data for the week ending June 28, 2019

U.S. crude oil refinery inputs averaged 17.3 million barrels per day during the week ending June 28, 2019, which was 47,000 barrels per day less than the previous week’s average. Refineries operated at 94.2% of their operable capacity last week.


  • Gasoline production decreased last week, averaging 9.9 million barrels per day.
  • Distillate fuel production increased last week, averaging 5.3 million barrels per day.

Imports

U.S. crude oil imports averaged 7.6 million barrels per day last week, up by 929,000 barrels per day from the previous week. Over the past four weeks, crude oil imports averaged about 7.3 million barrels per day, 13.1% less than the same four-week period last year.


Total motor gasoline imports (including both finished gasoline and gasoline blending components) last week averaged 536,000 barrels per day, and distillate fuel imports averaged 98,000 barrels per day.
 

Products inventories

  • Total motor gasoline inventories decreased by 1.6 million barrels last week and are at the five year average for this time of year.
  • Finished gasoline and blending components inventories both decreased last week.
  • Distillate fuel inventories increased by 1.4 million barrels last week and are about 6% below the five year average for this time of year.
  • Propane/propylene inventories increased by 1.3 million barrels last week and are about 11% above the five year average for this time of year.
  • Total commercial petroleum inventories increased by 2.5 million barrels last week.

Products supplied

Total products supplied over the last four-week period averaged 20.9 million barrels per day, virtually unchanged from the same period last year. Over the past four weeks:


  • Motor gasoline product supplied averaged 9.7 million barrels per day, down by 0.1% from the same period last year.
  • Distillate fuel product supplied averaged 4.1 million barrels per day over the past four weeks, up by 1.6% from the same period last year.
  • Jet fuel product supplied was up 2.2% compared with the same four-week period last year.

 

Source: EIA

Summary of Weekly Petroleum Data for the week ending June 21, 2019

Crude Inventory Data Shows Larger Than Expected Draw of 12.8 Million Barrels

U.S. crude oil refinery inputs averaged 17.3 million barrels per day during the week ending June 21, 2019, which was 73,000 barrels per day more than the previous week’s average.


Refineries operated at 94.2% of their operable capacity last week. Gasoline production increased last week, averaging 10.5 million barrels per day. Distillate fuel production decreased last week, averaging 5.3 million barrels per day.


U.S. crude oil imports averaged 6.7 million barrels per day last week, down by 812,000 barrels per day from the previous week. Over the past four weeks, crude oil imports averaged about 7.4 million barrels per day, 10.2% less than the same four-week period last year.


Total motor gasoline imports (including both finished gasoline and gasoline blending components) last week averaged 816,000 barrels per day, and distillate fuel imports averaged 33,000 barrels per day.


U.S. commercial crude oil inventories (excluding those in the Strategic Petroleum Reserve) decreased by 12.8 million barrels from the previous week. At 469.6 million barrels, U.S. crude oil inventories are about 5% above the five year average for this time of year.


Total motor gasoline inventories decreased by 1.0 million barrels last week and are at the five year average for this time of year. Finished gasoline inventories increased while blending components inventories decreased last week. Distillate fuel inventories decreased by 2.4 million barrels last week and are about 7% below the five year average for this time of year.


Propane/propylene inventories increased by 1.4 million barrels last week and are about 13% above the five year average for this time of year. Total commercial petroleum inventories decreased last week by 11.9 million barrels last week.


Info Source: StreetInsider

Crude Inventory 282K Barrels vs 1.05M Expected

Weekly Crude Storage Data Shows 282 Thousand Barrel Decline

U.S. crude oil refinery inputs averaged 16.8 million barrels per day during the week ending May 24, 2019, which was 189,000 barrels per day more than the previous week’s average. Refineries operated at 91.2% of their operable capacity last week.


Gasoline production decreased last week, averaging 9.9 million barrels per day. Distillate fuel production decreased last week, averaging 5.2 million barrels per day.


U.S. crude oil imports averaged 6.9 million barrels per day last week, down by 81,000 barrels per day from the previous week.


Over the past four weeks, crude oil imports averaged about 7.0 million barrels per day, 8.5% less than the same four-week period last year. Total motor gasoline imports (including both finished gasoline and gasoline blending components) last week averaged 1,087,000 barrels per day, and distillate fuel imports averaged 177,000 barrels per day.
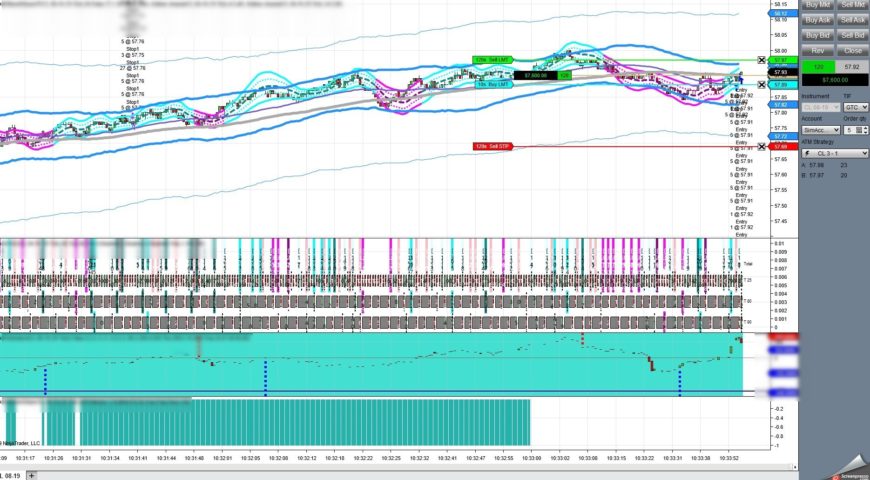
 

U.S. commercial crude oil inventories (excluding those in the Strategic Petroleum Reserve) decreased by 0.3 million barrels from the previous week. At 476.5 million barrels, U.S. crude oil inventories are about 5% above the five year average for this time of year. Total motor gasoline inventories increased by 2.2 million barrels last week and are about 1% above the five year average for this time of year. Finished gasoline inventories decreased while blending components inventories increased last week.


Distillate fuel inventories decreased by 1.6 million barrels last week and are about 5% below the five year average for this time of year. Propane/propylene inventories decreased by 0.1 million barrels last week and are about 17% above the five year average for this time of year. Total commercial petroleum inventories decreased last week by 1.6 million barrels last week.


Total products supplied over the last four-week period averaged 20.3 million barrels per day, down by 2.0% from the same period last year. Over the past four weeks, motor gasoline product supplied averaged 9.5 million barrels per day, down by 2.2% from the same period last year. Distillate fuel product supplied averaged 4.0 million barrels per day over the past four weeks, down by 2.6% from the same period last year. Jet fuel product supplied was up 2.9% compared with the same four-week period last year.

 

Source: StreetInsider

Summary of Weekly Petroleum Data for the week ending February 22, 2019

Weekly Crude Inventory Falls 8.6M Barrels

Summary of Weekly Petroleum Data for the week ending February 22, 2019


U.S. crude oil refinery inputs averaged 15.9 million barrels per day during the week ending February 22, 2019, which was 179,000 barrels per day more than the previous week’s average. Refineries operated at 87.1% of their operable capacity last week.


Gasoline production increased last week, averaging 9.6 million barrels per day. Distillate fuel production increased last week, averaging 4.8 million barrels per day.


U.S. crude oil imports averaged 5.9 million barrels per day last week, down by 1,605,000 barrels per day from the previous week. Over the past four weeks, crude oil imports averaged about 6.7 million barrels per day, 10.9% less than the same four-week period last year.

 

Total motor gasoline imports (including both finished gasoline and gasoline blending components) last week averaged 473,000 barrels per day, and distillate fuel imports averaged 331,000 barrels per day.


U.S. commercial crude oil inventories (excluding those in the Strategic Petroleum Reserve) decreased by 8.6 million barrels from the previous week. At 445.9 million barrels, U.S. crude oil inventories are about 3% above the five year average for this time of year. Total motor gasoline inventories decreased by 1.9 million barrels last week and are about 3% above the five year average for this time of year. Finished gasoline and blending components inventories both decreased last week.


Distillate fuel inventories decreased by 0.3 million barrels last week and are about 2% below the five year average for this time of year. Propane/propylene inventories decreased by 1.2 million barrels last week and are about 11% above the five year average for this time of year. Total commercial petroleum inventories decreased last week by 17.9 million barrels last week.


Total products supplied over the last four-week period averaged 20.8 million barrels per day, up by 2.1% from the same period last year. Over the past four weeks, motor gasoline product supplied averaged 8.9 million barrels per day, down by 1.5% from the same period last year.


Distillate fuel product supplied averaged 4.2 million barrels per day over the past four weeks, up by 4.5% from the same period last year. Jet fuel product supplied was up 2.5% compared with the same four-week period last year.


Data Source: StreetInsider

Crude Inventory Data Shows Larger Than Expected Build of 3.63M Barrels

Crude Inventory Data Shows Larger Than Expected 3.63 Million Barrels

Summary of Weekly Petroleum Data for the week ending February 8, 2019


U.S. crude oil refinery inputs averaged 15.8 million barrels per day during the week ending February 8, 2019, which was 865,000 barrels per day less than the previous week’s average.


Refineries operated at 85.9% of their operable capacity last week. Gasoline production decreased last week, averaging 9.6 million barrels per day. Distillate fuel production decreased last week, averaging 4.8 million barrels per day.


U.S. crude oil imports averaged 6.2 million barrels per day last week, down by 936,000 barrels per day from the previous week. Over the past four weeks, crude oil imports averaged about 7.2 million barrels per day, 11.2% less than the same four-week period last year.


Total motor gasoline imports (including both finished gasoline and gasoline blending components) last week averaged 457,000 barrels per day, and distillate fuel imports averaged 438,000 barrels per day.


U.S. commercial crude oil inventories (excluding those in the Strategic Petroleum Reserve) increased by 3.6 million barrels from the previous week. At 450.8 million barrels, U.S. crude oil inventories are about 6% above the five year average for this time of year.


Total motor gasoline inventories increased by 0.4 million barrels last week and are about 4% above the five year average for this time of year. Finished gasoline inventories increased while blending components inventories decreased last week.


Distillate fuel inventories increased by 1.2 million barrels last week and are about 2% below the five year average for this time of year. Propane/propylene inventories increased by 0.7 million barrels last week and are about 11% above the five year average for this time of year. Total commercial petroleum inventories increased last week by 6.5 million barrels last week.


Total products supplied over the last four-week period averaged 20.8 million barrels per day, up by 0.6% from the same period last year. Over the past four weeks, motor gasoline product supplied averaged 9.0 million barrels per day, up by 0.7% from the same period last year.


Distillate fuel product supplied averaged 4.3 million barrels per day over the past four weeks, up by 6.5% from the same period last year. Jet fuel product supplied was up 1.2% compared with the same four-week period last year.


Data Source: StreetInsider

Crude Oil Prices Sag on Inventory Build Up 07 February 2019

Oil Heads Lower On Small Inventory Build

A day after the American Petroleum Institute disappointed oil bulls by reporting an estimated inventory build across the board, the Energy Information Administration deepened the mood by saying U.S. crude oil inventories added 1.3 million barrels in the week to February 1.


At 447.2 million barrels, the EIA said, U.S. crude oil inventories are still above the seasonal average but not by much.


In gasoline, the authority reported a build of 500,000 barrels, with daily production at a little less than 9.9 million barrels. A week earlier, gasoline inventories fell by 2.2 million barrels after four weekly builds, and hefty ones, at that, with production averaging 9.9 million bpd.


Distillate fuel inventories last week shed 2.3 million barrels and production averaged 5.1 million barrels per day. A week earlier, inventories recorded a 1.1-million-barrel decline and production averaged 5 million bpd.


Crude oil prices in the meantime remain volatile although not as volatile as some expected after the announcement of the latest round of sanctions by Washington against Caracas. The worry was that the sanctions, targeting specifically PDVSA, will result in a shortage of heavy crude for U.S. refineries on the Gulf Coast, but in actuality, there seems to be sufficient spare production capacity around the world to fill any supply gap resulting from the latest developments in and around Venezuela.


It will take time for the market to factor in this fact and for now the concern about a shortage is being offset by the production cuts OPEC and Russia agreed at the end last year.


EIA’s report tends to have more influence on prices, but any effect will likely be temporary, as seen with earlier weekly inventory reports. All in all, many analysts expect the heightened oil price volatility we have been witnessing for a few months now to remain throughout 2019.


By Oilprice.com

Oil takes a hit as U.S. supplies rise a third week and global stock markets drop 12 October 2018

EIA Reports a Third Straight Weekly Rise in U.S. Crude Supplies

The Energy Information Administration reported Thursday that domestic crude supplies climbed by 6 million barrels for the week ended Oct. 5.


The data were released a day later than usual because of Monday’s Columbus Day holiday. Analysts surveyed by S&P Global Platts had forecast an increase of 1.61 million barrels, while the American Petroleum Institute on Wednesday reported a climb of 9.7 million barrels.


Gasoline stockpiles also rose by 1 million barrels last week, while distillate stockpiles declined by 2.7 million barrels, according to the EIA.


The S&P Global Platts survey had shown expectations for a supply rise of 422,000 barrels in gasoline and 1.71 million-barrel decline in distillates.


November crude CLX8, +0.30% fell $1.30, or 1.8%, to $71.87 a barrel on the New York Mercantile Exchange. That’s up from $71.63 before the supply data.


Source: MarketWatch

Open